Vienna
Contents |
1 Vienna: Demographic indicators
1.1 Population
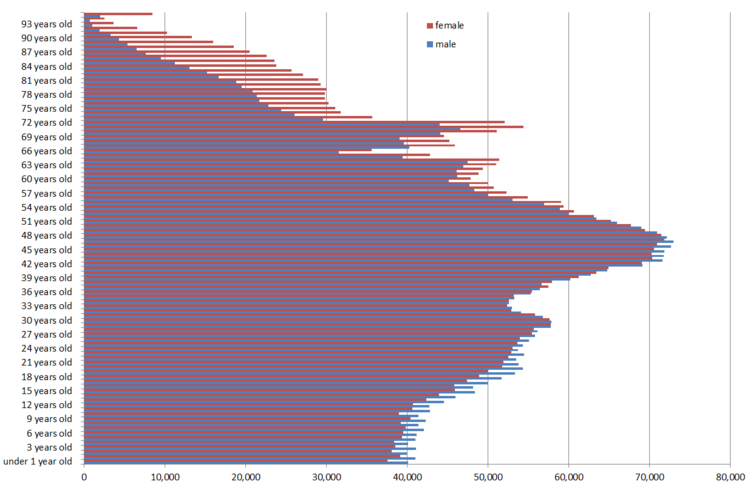
1.1.1 Population stocks on 1 January 2012 by age and sex - total population
Annotations
Q: STATISTICS AUSTRIA Population at the beginning of the year since 1982:
Origin of data
Until 2001, statistics on vital events was based on the results population estimates carried out starting from the state of the last population census on the basis of demographic equation. The population figure was estimated on the basis of provinces according to age, sex and four groups of nationalities.
Since 2002, vital events statistics has been based on the registrations of main residences quarterly transmitted by the Central register of residents (CRR). These data are constantly stored within a demographic database system and analysed together with the data on change of main residence (migration statistics) according to demographic criteria. The resident population consists of persons staying at least 90 days (including key day) at a place (registration of main residence).
1.2 Fertility
1.2.1 Total fertility rate (TFR), 1961-2011 - Total population
Annotations
Q: STATISTICS AUSTRIA
T: Total suppression
1.3 Mortality
1.3.1 Life expectancy by sex, 1970-2011 - total population
Annotations
Q: STATISTICS AUSTRIA
1.4 Migration
Immigration by citizenship
The regional distribution of international immigration to Austria was stable in recent years. The majority of about 40% of immigrants goes to the capital Vienna.
Austria
The group includes Austrians, who returned from abroad or migrate to Austria. Their number has stabilized in recent years at around 15,000 for Austria.
Annotations
Q: STATISTICS AUSTRIA
International migrations and migrations within Austria acc.to NUTS 3 regions:
Origin of data
Migration statistics is compiled by Statistics Austria and is based on the data (registrations and deregistrations) of the ZMR (central register of residents).
Important commentary
The results of the sample survey 2006 (survey date 31-10) differed from the results of vital statistics to an extent of about 14 000 persons. To protect consistency with the survey results, a revision of the current population statistics as well as of migration statistics was necessary. This revision concerns the years from 2002 to 2007.
Migration movements (immigration and emigration) are changes of main residence within the borders of areal units (internal move), or cross-border changes within Austria (internal migration), or cross-border changes outside Austria (external migration). This applies to minimum stays (sustained registration of main residence) of 90 days.
Depending on the scale of the area unit concerned, one and the same process of migration will be classified as internal move or as internal migration. Thus, a registration change between two communes of the same political district is internal migration on the c ommunal level, whereas, on the level of political districts, it is regarded as an internal move. FOR THIS REASON, NO AGGREGATION TO SUPERORDINATE AREA UNITS IS POSSIBLE, AND A SEPARATE QUERY IS REQUIRED.
The sum generated by internal moves and internal migrations in all area units of an adminstrative level (provinces, NUTS 3, political districts, communes) always remains the same and corresponds to the sum of internal migrations in Austria.
If in case of external migration no clear attribution to a country of origin/target or nationality was possible the movement was attributed to the category "unknown".
1.5 Households
Annotations
Q: STATISTICS AUSTRIA
Austrian Micro census - Labour Force Survey Yearly Data:
Origin of data and legal foundations
The results presented are data of the "European Labour Force Survey" which in Austria is conducted in the framework of the micro census. The micro census is a sample survey addressing about 1 500 households per week with its questionnaires. The European Labour Force Survey takes place in all member states of the European community. It gathers standardised information from randomly selected private households, institutional households remain out of account. Subsequently, these data are projected to the relative population number. National legal basis is regulation EWStV 2010, No. 111/2010.
Important note
The data presented are projected data from a 0.6% quarterly sample (annual average). Data derived from fewer than the projected 6 000 persons are random data characterised in the table by an S. Data from fewer than the projected 3 000 persons cannot be interpreted statistically; in the table, they are characterised by an N.
1.6 Labour
Anmerkungen/Annotations Q: STATISTICS AUSTRIA S: Sampling error Austrian Micro census - Labour Force Survey Yearly Data:
Origin of data and legal foundations
The results presented are data of the "European Labour Force Survey" which in Austria is conducted in the framework of the micro census. The micro census is a sample survey addressing about 1 500 households per week with its questionnaires. The European Labour Force Survey takes place in all member states of the European community. It gathers standardised information from randomly selected private households, institutional households remain out of account. Subsequently, these data are projected to the relative population number. National legal basis is regulation EWStV 2010, No. 111/2010.
Important note
The data presented are projected data from a 0.6% quarterly sample (annual average). Data derived from fewer than the projected 6 000 persons are random data characterised in the table by an S. Data from fewer than the projected 3 000 persons cannot be interpreted statistically.
