Vienna
Contents |
1 Vienna: Demographic indicators
1.1 Population
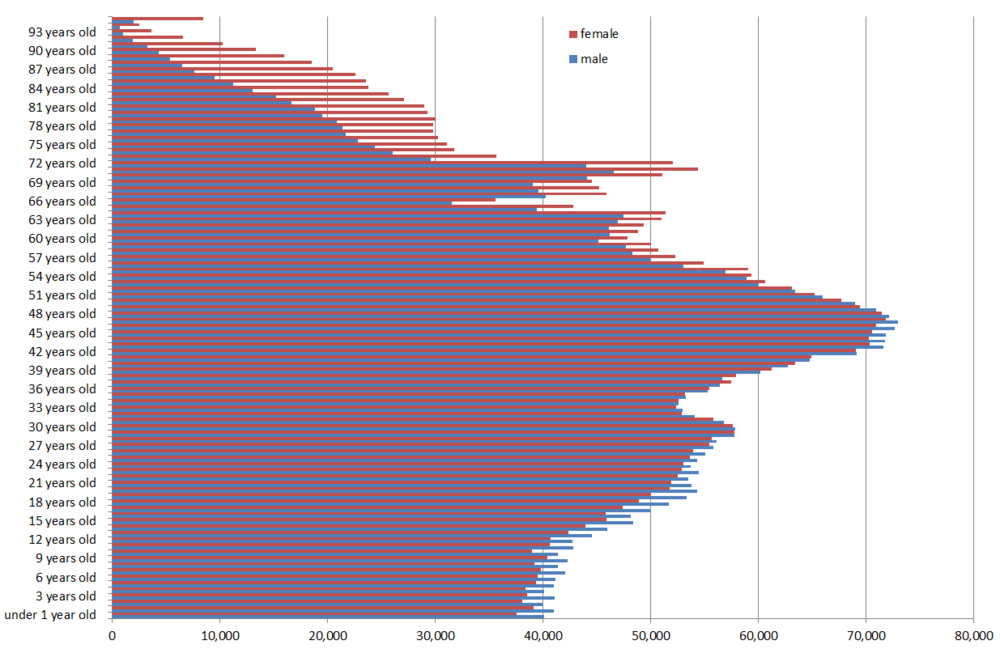
1.1.1 Population stocks on 1 January 2012 by age and sex - total population
Annotations
Q: STATISTICS AUSTRIA Population at the beginning of the year since 1982:
Origin of data
Until 2001, statistics on vital events was based on the results population estimates carried out starting from the state of the last population census on the basis of demographic equation. The population figure was estimated on the basis of provinces according to age, sex and four groups of nationalities.
Since 2002, vital events statistics has been based on the registrations of main residences quarterly transmitted by the Central register of residents (CRR). These data are constantly stored within a demographic database system and analysed together with the data on change of main residence (migration statistics) according to demographic criteria. The resident population consists of persons staying at least 90 days (including key day) at a place (registration of main residence).
1.2 Fertility
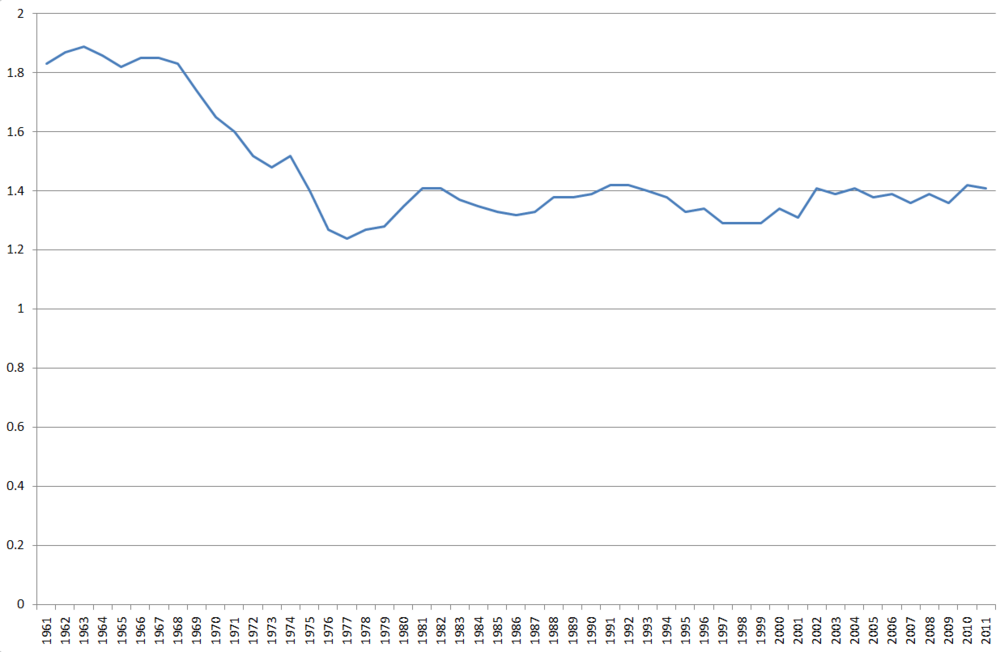
1.2.1 Total fertility rate (TFR), 1961-2011 - total population
Annotations
Q: STATISTICS AUSTRIA
T: Total suppression
1.3 Mortality
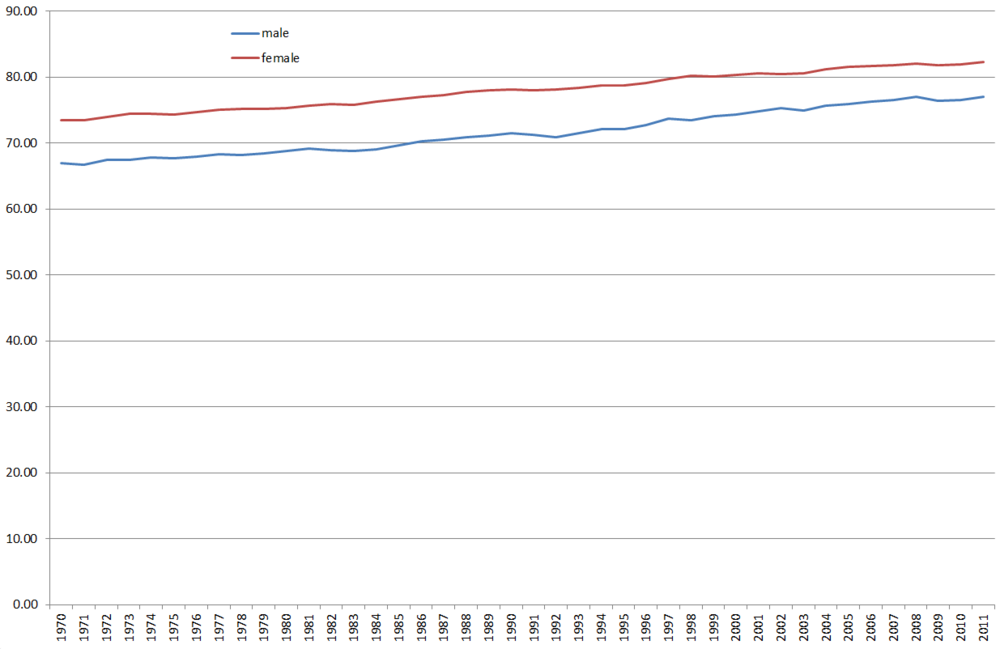
1.3.1 Life expectancy by sex, 1970-2011 - total population
Annotations
Q: STATISTICS AUSTRIA
1.4 Migration
5278,4924,4772,4635,2637,2350,2151,2110,908,650,561,551,516,377,6848


